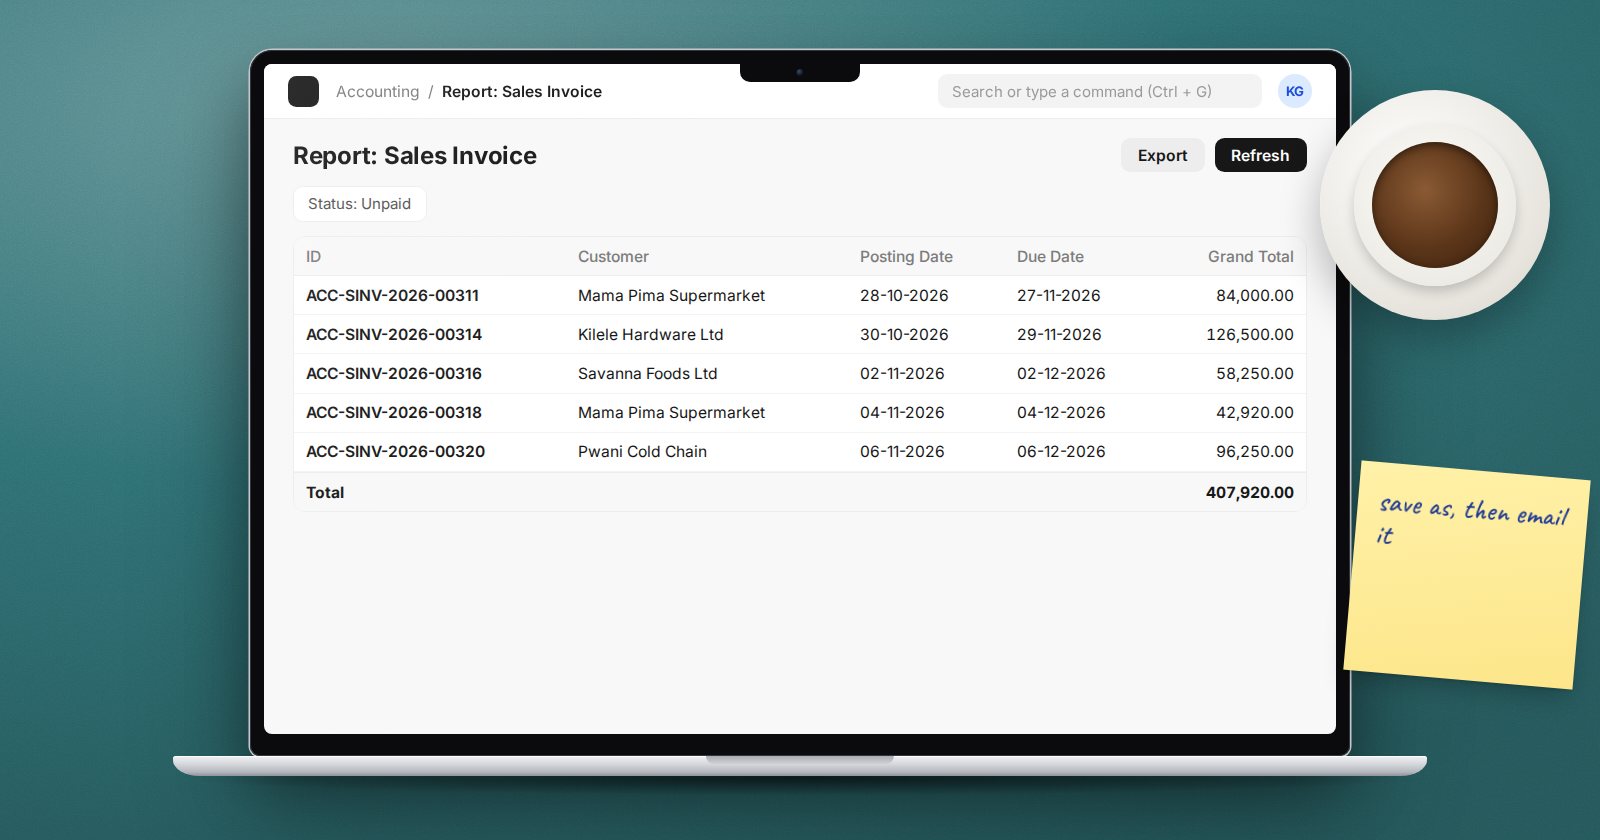
Before you ask a developer for a report, try the Report Builder. It is built into every list in ERPNext, it respects each user's permissions, and a useful report takes minutes. Many requests for "a custom report" end here.
Open the Report view
Go to any list, such as Sales Invoice. Use the view switcher at the top of the list and choose Report. The list turns into a spreadsheet-like grid with the same filters you already know.
Everything you do in this view is saved as your personal settings for that DocType until you save it as a named report.
Choose the columns
From the settings menu, use Pick Columns to tick the fields you want, or Add Column to insert one at a specific place. You can drag column headers to reorder them and drag their edges to resize.
You can also add fields from child tables. Pick fields from Sales Invoice Item, such as Item Code and Qty, and the report shows one row per invoice line instead of one row per invoice. That is often exactly what a stock or sales analysis needs, and it is the step most users never discover.
Filter first
Add filters before anything else: date range, company, status, docstatus. A filter like "Docstatus = 1" keeps drafts and cancelled documents out of totals. Use the date filter's range option rather than typing a start and end each time.
Group and summarise
Use Group By in the toolbar, choose the field to group on, and an aggregate: Count, Sum or Average of a numeric field. For example:
- Group By Customer, Sum of Grand Total - sales per customer.
- Group By Item Group with Sum of Qty, using the child table columns - quantity sold per item group.
- Group By Status, Count - how many invoices are paid, unpaid or overdue.
Grouping has limits: ERPNext does not allow grouping that mixes a parent and a child table, or two different child tables, and tells you if you try.
Turn on Show Totals from the menu to add a totals row at the bottom.
Save it as a report
When the view answers the question, use Save As and give it a clear name, such as "Monthly Sales by Customer". This creates a Report record of type Report Builder. Saved reports appear in the sidebar of the DocType's list and in search, so other users can find them.
Who sees a saved report? Anyone with access to the underlying DocType can open it, and each user only sees the rows their role and User Permissions allow. A branch manager restricted to one branch opens the same report as the director and sees only their branch.
Export and schedule
- Export gives you Excel or CSV of the current view. You can choose to export all matching rows rather than only the ones loaded on screen.
- Setup Auto Email creates an Auto Email Report that sends the saved report daily, on weekdays, weekly or monthly, as HTML, XLSX, CSV or PDF.
Reports return at most the number of rows set in Max Report Rows in System Settings, 100,000 by default. If a report needs more than that, filter it further, or it is a sign the question needs a different report.
Know when to stop
Report Builder works on one DocType and its child tables. Move on to a Query Report when you need:
- data from two unrelated DocTypes in one row, such as invoices with their payment entries,
- calculated columns, such as days overdue,
- totals that depend on conditions across tables.
Before you do, ask whether two simple saved reports would answer the question just as well. They usually cost less to keep working.
Try it
- Open the Sales Invoice list and switch to Report view.
- Filter to submitted invoices this month and add Customer, Grand Total and Outstanding Amount.
- Group By Customer with Sum of Grand Total and turn on Show Totals.
- Save it as "This Month Sales by Customer" and export it to Excel.
- Log in as a user with a User Permission on Customer and open the same report.
Report Builder is the first reporting tool we teach in ERPNext Administration Without Code, before Query Reports and dashboards.