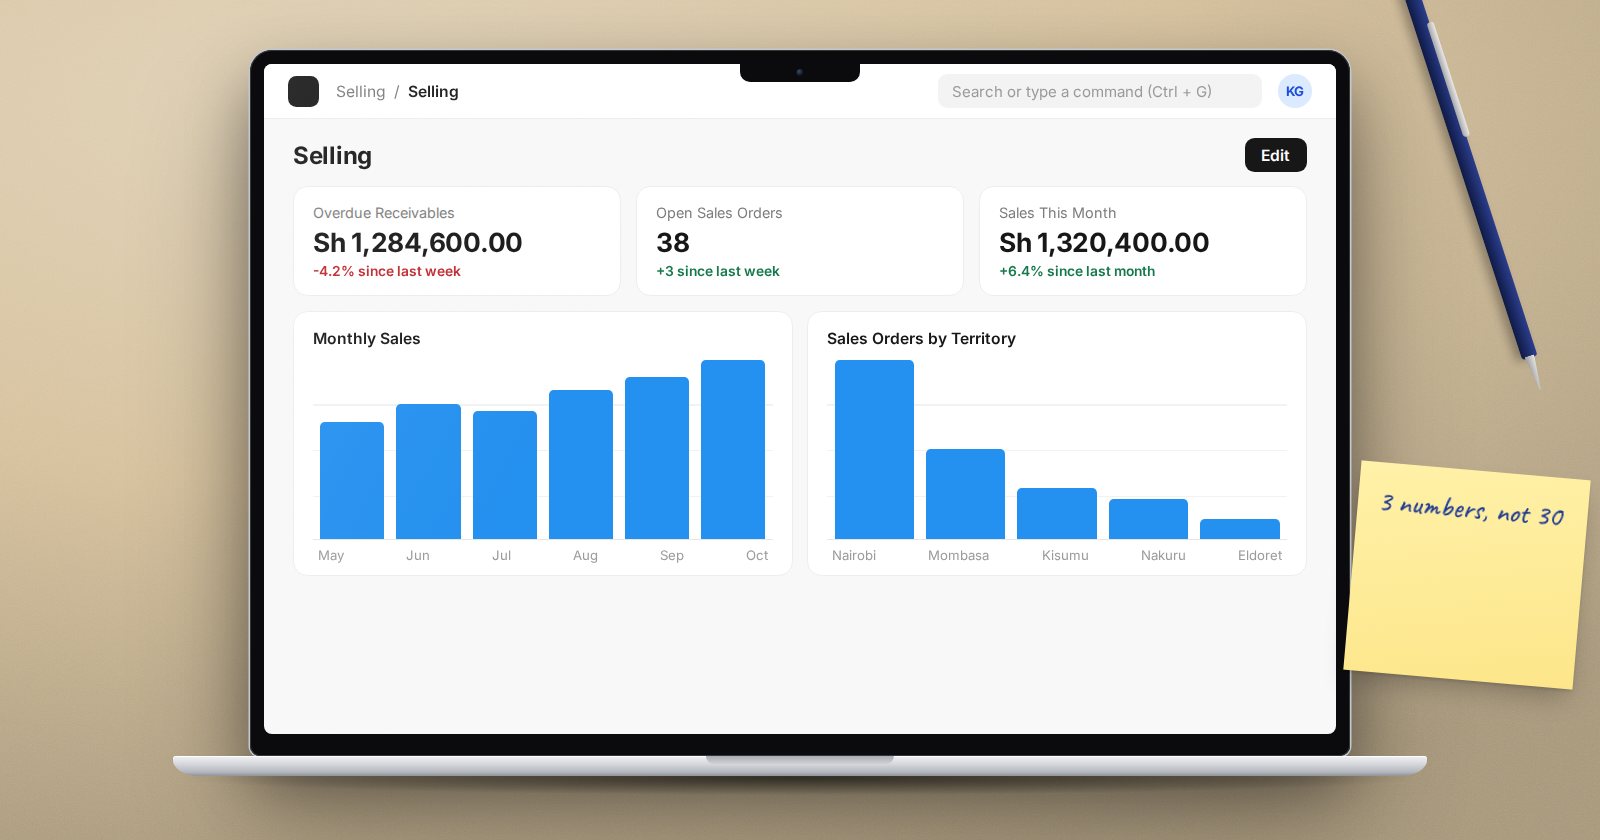
A manager who opens ERPNext in the morning should see the three or four numbers that matter, without running a report. Number Cards and Dashboard Charts do that, and you build them from the desk.
Number Cards: one number, one question
A Number Card shows a single value, such as "Unpaid invoices" or "Sales this month". Create one by searching "New Number Card".
Pick a Type:
- Document Type - count or calculate over a DocType. Choose the Function (Count, Sum, Average, Minimum or Maximum), the field to aggregate, and filters.
- Report - take a value from a column of a saved report, using Sum, Average, Minimum or Maximum.
- Custom - call a whitelisted Python method from a custom app. This one needs a developer.
Example: an "Overdue receivables" card.
- Type: Document Type
- Document Type: Sales Invoice
- Function: Sum, of Outstanding Amount
- Filters: Status = Overdue, Docstatus = 1
Leave Show Percentage Stats on and pick a Stats Time Interval (Daily, Weekly, Monthly or Yearly) to show the change against the previous period under the number.
Dashboard Charts: the trend behind the number
A Dashboard Chart draws a line, bar, percentage, pie, donut or heatmap. The Chart Type decides where the data comes from:
- Count, Sum or Average - a time series over a DocType. Set Time Series Based On (a date field, such as Posting Date), Value Based On for Sum or Average, a Timespan (Last Year, Last Quarter, Last Month, Last Week, or a date range) and a Time Interval (Yearly down to Daily).
- Group By - one bar or slice per value of a field, such as invoices by customer group, with Count, Sum or Average, and a limit on the number of groups.
- Report - draws from a saved report's data. In a Query or Script Report, the Set Chart action and then Add Chart to Dashboard do this for you.
- Custom - uses a chart source written by a developer.
Example: a monthly sales chart. Chart Type Sum, Document Type Sales Invoice, Time Series Based On Posting Date, Value Based On Base Grand Total, Timespan Last Year, Time Interval Monthly, Type Bar, filter Docstatus = 1.
Put them where people look
Charts and cards earn their keep on a Workspace, the landing page users already open. Open the workspace, switch to edit mode, add a Chart or Number Card block, pick yours, and save. A Workspace has its own tables for charts and number cards, so a block can be moved around like any other.
You can also group charts and cards into a Dashboard record and open it from the dashboard view. That suits a management screen that is not tied to one module.
Who sees what
Both cards and charts read data through the normal permission-checked queries. A user only sees a card if they can read its DocType or open its report, and the number they see is computed from the records they are allowed to see. A sales rep limited by User Permissions sees their own total, not the company's.
Tick Is Public on a card or chart you want other users to be able to add. Without it, a card stays private to its creator.
Keep them fast
- Charts cache their results and show Last Synced On. Use the refresh action when you need fresh numbers immediately.
- Filter early. A chart summing every invoice since go-live gets slower each year. Last Year or Last Quarter is usually enough.
- Fewer is better. Five cards that drive action beat twenty that people learn to ignore.
Try it
- On a test site, create the Overdue receivables number card above.
- Create the monthly sales Dashboard Chart.
- Add both to the Accounting workspace in edit mode.
- Log in as a user with User Permissions on Company and compare the numbers.
Dashboards come right after reports in ERPNext Administration Without Code, because a good card is a good report reduced to one number.